


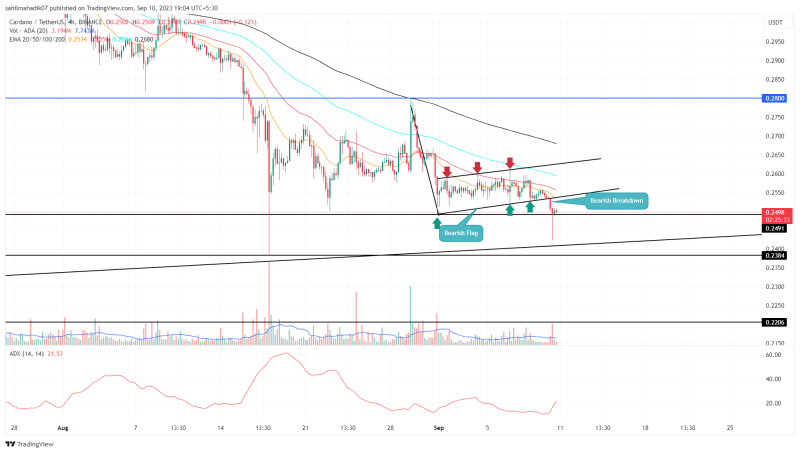
For over a week, the Cardano price has been experiencing significant fluctuations amid growing uncertainties in the crypto market. Although the price trend hasn’t distinctly favored bulls or bears, it formed within two parallel trend lines, suggesting a bearish flag pattern. Notably, on August 10, ADA coin witnessed a considerable outflow, breaking past the flag pattern’s lower trend line, signaling a potential continuation of the bearish trend.
Also Read: Cardano (ADA) Developers Intensifies Work on P2P Functionalities
Bearish Flag Breakdown Hints a Price Drop to $0.2
- A bearish breakdown from the inverted flag pattern offers a short-selling opportunity for traders
- A long-rejection candle near the $0.242 mark reflects the aggressive demand pressure
- The intraday trading volume in the ADA coin is $100 Million, indicating a 47% gain.
Source- Tradingview
Earlier in today’s trading session, ADA price registered an intraday loss of 4.5%. This sharp decline led to a substantial breach of the lower support trendline. Typically, such a breakdown would be expected to unleash the pent-up bearish momentum, further empowering the sellers.
However, at the time of writing, the seven largest cryptocurrency price stands at $0.25, displaying a pronounced rejection at the lower levels, indicating buyers’ resilience in defending this critical price point. Such buying activity hints at a retest phase, aiming to determine the capacity of the breached support to transform into a suitable resistance.
If ADA price continues trading below the noted support-turned-resistance level, a further descent to $0.24 seems plausible, followed by $0.22.

1 ADA to USD = $0.246731 -2.83% (24h) Buy / Sell


Buy Crypto on an easy to use platform
Invest in leading cryptocurrencies such as Bitcoin, Ethereum, Cardano and more…

ADA
-

btc
-

eth
-

xrp
-

bnb
-

sol
-

ltc
-

polygon
-

cardano
-

tron
-

doge

USD
-

USD
-

INR
-

JPY
-

CNY
-

GBP
-

EUR
Can Cardano Resume Bullish Recovery?
Despite the bearish flag pattern pointing towards a potentially extended downtrend for Cardano, the recently observed rejection candle injects a hint of doubt in the sellers’ intentions. Should the upcoming retest result in a daily candle closing above $0.2534, thereby re-entering the confines of the flag pattern, it would undermine the bearish forecast. Such an outcome could signify a “false breakdown,” potentially propelling ADA to higher price zones.
- Average Directional Index: An uptick in the ADX slope reflects the sellers having enough room to carry an aggressive downfall.
- Exponential Moving Average: The 200 EMA slope of a 4-hour time frame acts as dynamic resistance against bullish pullbacks.


