


The crypto market started September on a bearish note, following the sets of August’s downfall. A majority of major coins witnessed extended correction and returned to monthly support. While the overall downtrend is active, the potential traders must form a suitable setup before entering a new position.
As of 9:47 a.m. on Sunday, the global cryptocurrency market capitalization is at $1.04 trillion, showcasing a 0.27% gain since yesterday. In addition, the market shows a drop of 44% loss in trading volume, currently standing at $18.92 Billion.
Also Read: BTC Price Prediction: Bitcoin Rejected At $27k, Is $20k Imminent?
Bitcoin Price Analysis: Double Bottom Pattern Offers Recovery Chance
Source- Tradingview
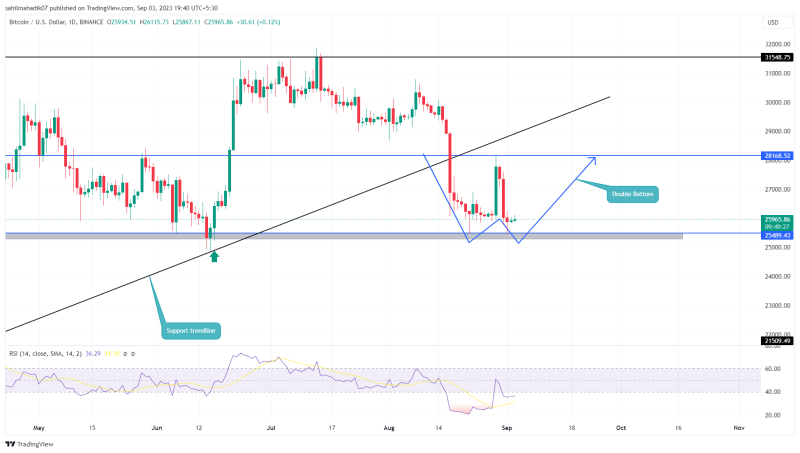
Amid the August end downfall, the largest cryptocurrency witnessed a sharp drop from $28176 to $25451, registering a 9.8% loss. However, the falling Bitcoin price started experiencing demand pressure at the $25500 mark, evidenced by the lower price rejection candle in the daily chart.
Thus the potential of a second reversal from $25500 support within a month, indicates the formation of a double bottom pattern. The chart setup accentuates increased demand pressure at bottom support, resulting in a strong upswing in the near future.
The anticipated recovery should bolster the bulls to change the $28200 barrier for an opportunity for higher recovery.
Toncoin Price Analysis: Breakout Opportunity Set Target Above $2
Source- Tradingview
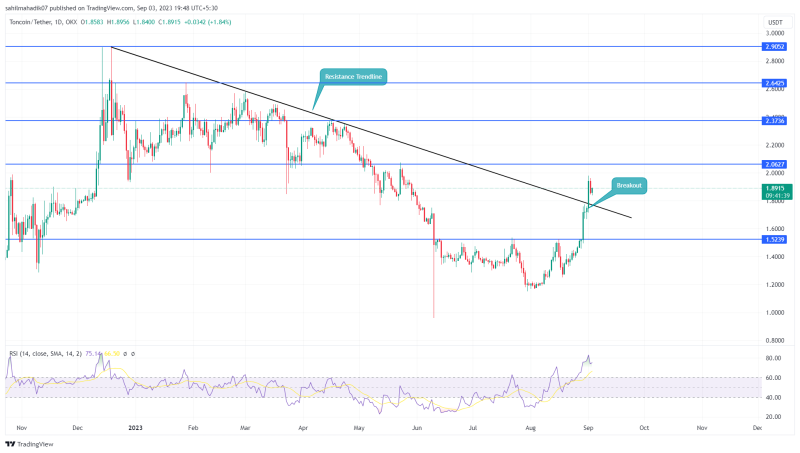
On September 1st, the Toncoin price gave a massive breakout from the resistance trendline which carried a downtrend for over eight months. This breakout signals a change in market dynamic as market participation could switch from selling on rallies sentiment to buying on dips.
By the press time, the TON price trades at $1.87 and is currently under a retest phase. This pullback could serve as a crucial confirmation of the newfound bullish momentum. Subsequently, we can set our sights on potential price targets.
The initial target stands at $2, followed by $2.37, and $2.64.
Synthetix Price Analysis: Wedge Pattern May Push $SNX to $2.2
Source- Tradingview
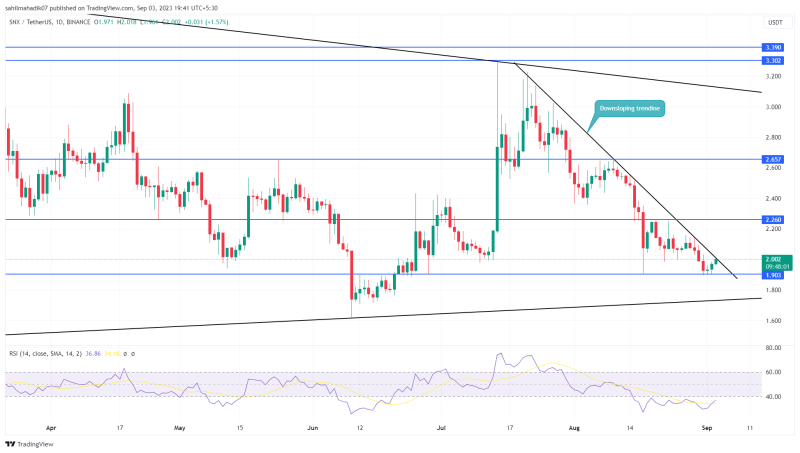
Over the past six weeks, the Synthetix price has witnessed a steep correction under the influence of a downsloping trendline. During this period, the coin price reverted from this resistance line on multiple occasions, indicating that traders have been quick to sell whenever there’s a bullish bounce.
Currently, the SNX price trades at $1.988 and retests the overhead trendline. If the bearish momentum persists, the altcoin may fall again and probably retest the $1.8.
Therefore, the potential buyers must wait for a bullish breakout from the upper resistance, which may set a recovery to $2.2, followed by $2.6 and $3.3.


