


Ethereum Price Analysis: Amid the increasing FUD in the crypto market, the Ethereum price correction phase stalled at the support of the megaphone pattern near the $1830 mark. This support was expected to bolster buyers for a bullish reversal, but the price trend turned sideways. The consolidation reflects a weakness in bullish momentum as buyers fail to push the altcoin higher despite obtaining strong support. Will ETH price rebound to $2000 or the correction phase may prolong below $1800?
Also Read: Ethereum Price Charts Signal Buy The Dip Opportunity Ahead
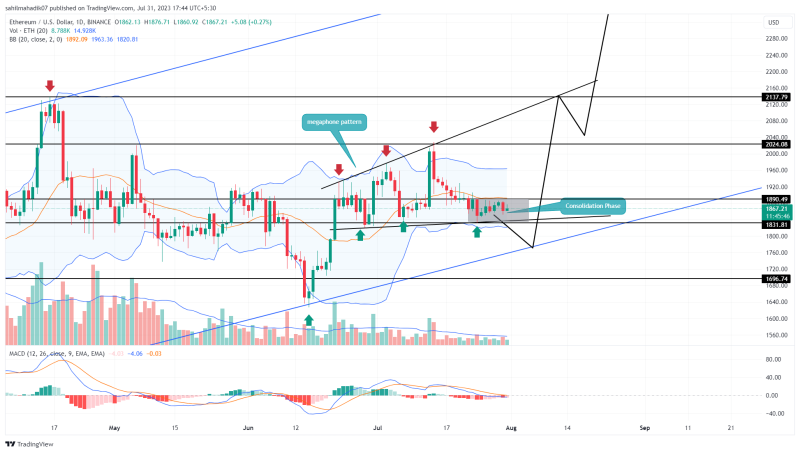
Ethereum Price Daily Chart
- The price range between $1890 and $1830 creates a no-trading zone.
- A bullish breakout from the $1890 resistance would trigger a new recovery cycle within the megaphone pattern
- The intraday trading volume in Ether is $4.8 Billion, indicating a 48% gain.
Source- Tradingview
On July 24th, the Ethereum price witnessed a 2% intraday fall and reached the bottom trendline of the megaphone pattern at $1830. Since then the price trend turned sideways and remained within the range of the aforementioned red candle.
The $1890 resistance and $1830 support are the crucial levels that can influence the near future trend of ETH coins. Currently, the second-largest cryptocurrency Ethereum trades at $1868, with a bullish candle of 0.3% gain.
If the overhead supply continues to pressure the market participants, a breakdown below the pattern support trendline and $1830, will increase the selling momentum. The breakdown may. pull the price to $1800 support, registering a potential 4% drop.
The anticipated pullback to $1800 can allow interested traders to accumulate at the support trendline carrying the current uptrend.

1 ETH to USD = $1859.13 -1.11% (24h) TRADE

ETH
-

btc
-

eth
-

xrp
-

bnb
-

sol
-

ltc
-

polygon
-

cardano
-

tron
-

doge

USD
-

USD
-

INR
-

JPY
-

CNY
-

GBP
-

EUR
Here’s How ETH Price May Regain $2000 Mark
For Ethereum price to regain its bullish recovery, the buyers need to break the overhead resistance of $1890. This breakout will indicate the microphone pattern is still intact and the bull cycle within this structure could lead Ethereum price near $2200.
- Bollinger band: The lower support of Bollinger band moving sideways could offer strong support for crypto buyers.
- Moving average convergence divergence: the MACD(blue) and signal(Orange) lines going flat at the median level indicate uncertainty traders.


