


Eleven-month price action in Cardano coin indicates the ongoing trend in the technical chart is sideways. Amid this lateral movement, the prices project a short-term downtrend, evident by a downsloping trendline. On July 14th, the ADA price faced its latest reversal from the resistance trendline which led to a 22% drop and reached the current trading price of $0.296. Will correction extend or can buyers give a counted attack?
Also Read: Binance Delisting Cardano (ADA) And Polygon (MATIC), But There’s A Catch
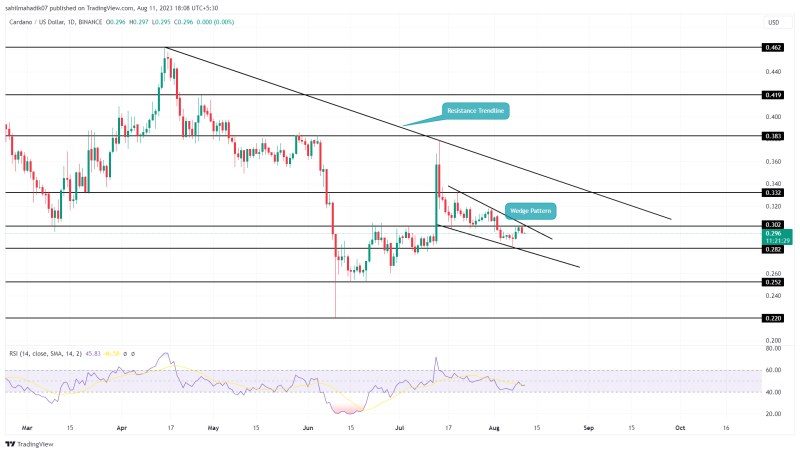
Cardano Price Daily Chart
- The falling wedge pattern is often considered the end of a downward trend,
- A decisive breakout from the wedge pattern would set the ADA price for a 12% upswing
- The intraday trading volume in the ADA coin is $300.6 Million, indicating an 18% gain.
Source- Tradingview
In the daily time frame chart, the falling Cardano price has shaped into a downsloping wedge pattern. This pattern consists of two converging trend lines that hint at a gradual weakening of selling momentum.
The above-mentioned pattern often results in a significant upswing upon the breakout of its resistance trendline. Currently, the ADA price trades at $0.286 and continues to wobble between the two falling trendlines.
The eight largest cryptocurrencies would continue this downfall until the wedge pattern barriers are intact. Thus, a potential breakout from the overhead trendline would signal a turning point, which could surge the prices by 10-12% and hit the long-coming resistance trendline.

1 ADA to USD = $0.2959528 -0.5% (24h) TRADE

ADA
-

btc
-

eth
-

xrp
-

bnb
-

sol
-

ltc
-

polygon
-

cardano
-

tron
-

doge

USD
-

USD
-

INR
-

JPY
-

CNY
-

GBP
-

EUR
Can ADA Price Trigger a New Recovery Cycle?
While the anticipated upswing could bolster buyers by 10%, the short-term will remain bearish until the downsloping trendline persists. For buyers to trigger a bull cycle with a long-term sideways trend, the coin price needs to give a daily candle closing above the trendline resistance which could accurately determine the underlying bullish momentum.
- Fibonacci Retracement level: The altcoin price found suitable support at the 61.8% FIB level.
- Relative Strength Index: The daily RSI slope above 40% would reflect a suitable possibility for a bullish reversal;


