


Within the last two weeks, the Bitcoin price showcased a remarkable recovery as it jumped from $25000 to the $31150 mark. The aforementioned level is also the April 2023 peak and therefore holds sufficient supply pressure to tackle bulls. The daily chart started projecting long-wick rejections indicating the sellers are actively defending this level. Are the bulls exhausted, or is this a pullback before the next leap?
Also Read: Bitcoin Bull Run: BlackRock BTC ETF Likely To Get Green Flag
Bitcoin Price Daily Chart:
- A new downsloping trendline can carry the potential correction in Bitcoin price
- Amid the current downfall, the decreasing volume suggests the correction phase is temporary.
- The intraday trading volume in Bitcoin is $9.12 billion, indicating a 38% loss.
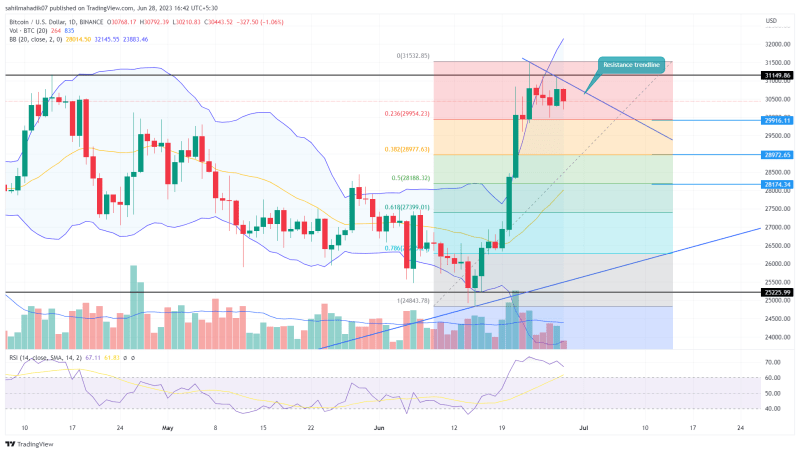
(Source: Tradingview)
The overhead supply pressure has stalled Bitcoin price growth at $31150. Moreover, the higher-price rejection candles at this resistance indicate a higher possibility of a bearish reversal.
Anyways, this potential correction could be beneficial for BTC buyers to maintain the long run. This retracement could absorb the build-up selling pressure and replenish the exhausted bullish momentum.
As per the Fibonacci retracement tool, the $30000 aligned with 23.6% FIB, followed by $28980(38.2%) and $29000(50%) stands as an important support zone that will assist buyers to maintain a bullish outlook
Will Bitcoin Price Surpass $31500?
The daily time frame chart shows a new resistance trendline that can be used to follow the possible pullback in Bitcoin price. Until this dynamic resistance is intact, the coin price will maintain a downtrend and could plunge to the nearest support zone of $30000, and $28980. Therefore, a breakout above this trendline will be a key signal for uptrend continuation.
- Fibonacci retracement levels: Until the Bitcoin price holds above the 50% FIB level the overall trend remains bullish
- Exponential Moving Average: The 20-day EMA slope wavering near the $28980 level creates a strong support zone.


