


After the massive dump on August 17th, the largest cryptocurrency Bitcoin has witnessed high volatility for nearly two weeks. While the downward projection continues, the daily candle shows a long-wick rejection on either side, reflecting uncertainty in bearish momentum. Will this indecisiveness lead to a bullish pullback or it’s a small breather for prolonged correction?
Also Read: Pro-Bitcoin DeSantis Rises As Champion After GOP Debate; Trump Still Leads
Bitcoin Daily Chart: Key Points
- A bullish breakout from the chart pattern will set an 8% price jump
- The Bitcoin fear and greed index at 38% reflects bearish sentiment among market participants
- The intraday trading volume in Bitcoin is $6.2 Billion, indicating a 30% loss.
Source- Tradingview
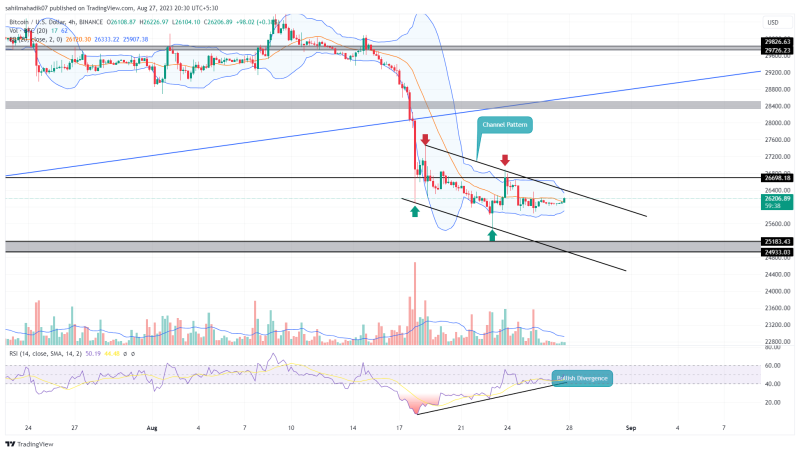
The 4-hour time frame chart shows the ongoing downtrend in a more stable manner wobbling between two parallel walking trendlines. This price behavior reflects the formation of a known bullish reversal pattern called the falling parallel channel.
By the press time, the Bitcoin price traded at $26166 with an intraday gain of 0.32%. This uptick will lead the coin price back to the overhead trendline with a potential bullish breakout. Anyhow, after a massive downfall, the asset price tends to show a minor pullback in order to stabilize the prevailing downtrend.
A 4-hour candle closing above the upper trendline will kickstart this anticipated bullish pullback. The post-breakout rally will push the prices 8% higher and retest the $28500 barrier.
The crypto holders must be cautious at this barrier as with the overall trend still negative, the sellers could recuperate bearish momentum for prolonged correction.

1 BTC to USD = $26147.884 0.35% (24h) Buy / Sell


Buy Crypto on an easy to use platform
Invest in leading cryptocurrencies such as Bitcoin, Ethereum, Cardano and more…

BTC
-

btc
-

eth
-

xrp
-

bnb
-

sol
-

ltc
-

polygon
-

cardano
-

tron
-

doge

USD
-

USD
-

INR
-

JPY
-

CNY
-

GBP
-

EUR
Will BTC Price Fall Back to $25000?
While the possibility of a bullish reversal seems valid, the two trendlines are currently leading to the ongoing downfall. Until the two trend lines are intact, the BTC price may extend the downward march. A potential reversal from this upper trendline will trigger a new bear cycle within the channel and lead the prices back to $25000.
- Bollinger Band: The narrowing range on the Bollinger Band indicator shows high volatility in the market.
- Relative Strength Index: Contrary to the falling price, the RSI slope shows an evident rise reflecting growing bullish momentum.


