


XRP Price Analysis: The XRP price recovery rally recently turned down from the $0.93 barrier and witnessed a sharp correction. The exhausted bullish momentum plunged the coin price 28% down to the $0.069 mark and switched to sideways action. However, the consolidation phase limited between two converging trendlines indicates the formation of a bullish continuation pattern called pennant. Here’s how interested can ride the next leap in XRP.
Also Read: Crypto Exchange Gemini Teases Hint Of XRP Relisting Soon
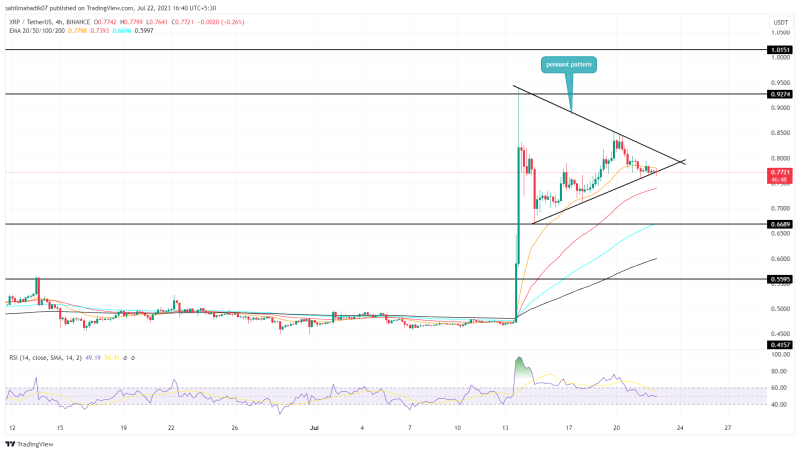
XRP Price Daily Chart:
- A bullish reversal from the lower trendline suggests the XRP price may prolog sideways action for a few more days
- An upside breakout from the overhead trendline will set the altcoin for a 25% upswing.
- The intraday trading volume in the XRP is $1.5 Billion, indicating a 32.1% loss.
Source: Tradingview
The XRP price shows the formation of a pennant pattern in the 4-hour time frame chart. This chart setup is considered a continuation pattern, indicating that the prevailing trend is likely to continue after a period of consolidation.
The coin price rebounded twice from the upper trendline and thrice from the lower indicating this pattern’s strong influence on market participants. Therefore, the short-term sideways trend in XRP price will persist, until the two trendlines are intact.
By the press time, the XRP price trades at $0.77 and is trying to obtain another support from the lower trendline. Thus, interested traders can wait for a breakout above the pattern’s resistance trendline before taking a long position in the market.

1 XRP to USD = $0.7706586 -0.68% (24h) TRADE

XRP
-

btc
-

eth
-

xrp
-

bnb
-

sol
-

ltc
-

polygon
-

cardano
-

tron
-

doge

USD
-

USD
-

INR
-

JPY
-

CNY
-

GBP
-

EUR
Will XRP Price Surpass the $1 Ceiling?
The narrowing range of the triangle pattern will soon lead the XRP price toward a breakout opportunity. With the anticipated bullish breakout, the 4-hour candle closing above the overhead trendline will hint at the replenished bullish momentum and prolong the recovery rally to the $1.08 mark. If the breakout triggers this weekend, the XRP buyers will have sufficient time to reach the target before July End.
On a contrary note, a breakdown below the lower trendline will offset the bullish thesis.
- Fibonacci Retracement Level: Amid the current correction, the XRP price showing sustainability above the 50% FIB level suggests the overall trend is bullish.
- Relative Strength Index: The daily RSI slope at 50% indicates a neutral sentiment among market participants.


