


Amid the April-may downfall in the crypto market, the seventh largest cryptocurrency-Cardano returned to the 2022 bottom support of $0.24. The ADA price has been hovering above this support for nearly a month, trying to gather buyers accumulating at discounted prices. The lower price rejection observed at this support indicates the presence of demand and the possibility of a bullish reversal.
Also Read: Cardano Price Could Surge 17.5% on this Breakout; Buy Today?
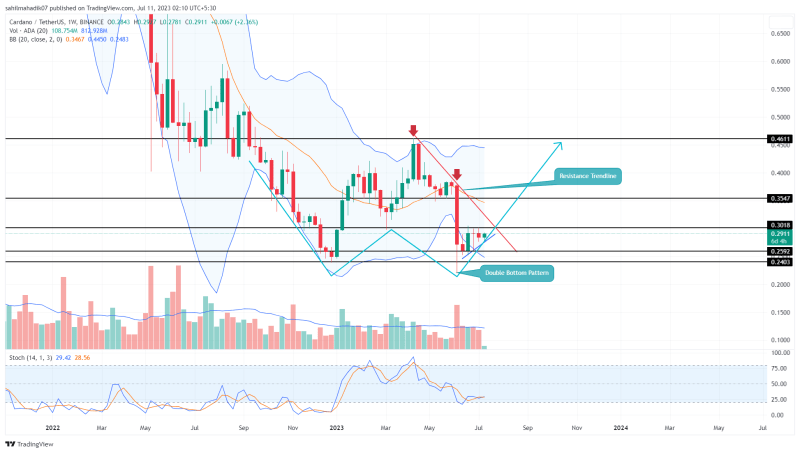
Cardano Price Daily Chart
- The ADA price obtained high buying pressure from $0.24 support.
- A breakout above the overhead trendline will signal a fresh recovery rally
- The intraday trading volume in the ADA coin is $246.6 Million, indicating a 33% gain
Source- Tradingview
As the Cardano price shows the possibility of a bullish reversal from the $0.24 second time in the past six months, this level stands in a strong accumulation zone. In the weekly chart, these two reversals indicate the formation of a famous bullish reversal pattern called the double bottom.
As of now, the ADA price trades at $0.29 and continues to waver sideways as the market sentiment stalls from its recovery track. However, if the demand pressure from the bottom persists, the buyers will attempt an upturn and challenge the downsloping trendline carrying the short-term correction in this altcoin.
A breakout above this trendline will be the first signal for trend reversal and further development of a bullish pattern.
Can ADA Price Rise to $0.46?
A potential breakout from the resistance trendline will intensify the bullish momentum in the ADA price. The post-breakout rally will bolster the buyers for a 22% rise and hit the next significant resistance of $0.35. However, under the influence of a double bottom pattern, the coin price is likely to challenge the $0.46 neckline, to obtain a better signal for trend change.
- Stochastic: Concerning the two swing lows at $0.24, the Stochastic slopes showed a significant rise indicating the underlying buying pressure is rising.
- Bollinger Bands: A downtick in the lower band of the Bollinger Band indicator suggests the seller has not thrown the towel yet.


