


Terra Classic Price Analysis: Over the last seven months, the LUNC coin price showcased an active downtrend under the influence of a falling wedge pattern. The prices have resonated within this pattern’s converging trendline several times, indicating the traders are respecting this setup. However, in theory, this pattern is known to trigger a significant upswing upon the breakout of its trendline. Here’s how potential buyers could benefit from this trendline.
Also Read: LUNC News: Terra Luna Classic L1TF Reveals Plan; Validator Burns To Revive $LUNC To $1?
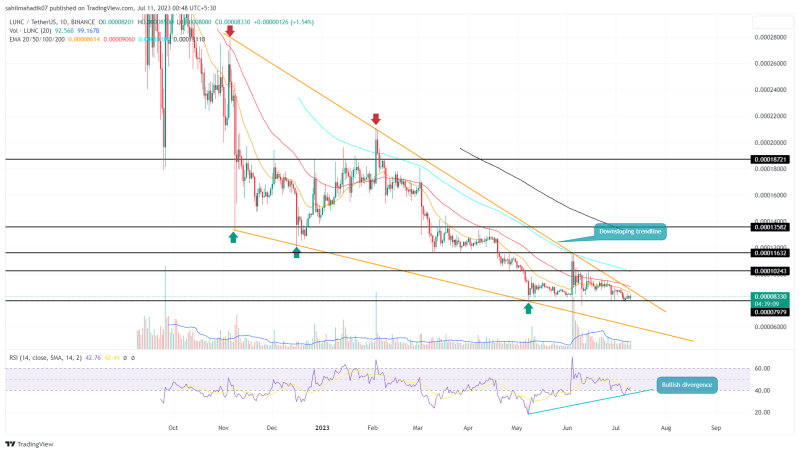
LUNC Price Daily Chart
- The falling wedge pattern governs the current downturn in the LUNC price
- Losing $0.0008 support will accelerate selling pressure and prolong the current downfall.
- The intraday trading volume in the LUNC coin is $30.2 Million, indicating a 75.2% gain.
Source- Tradingview
By the press time, the LUNC price trades at $0.0000828 and continues to narrow within the converging trendline of the wedge pattern. This gradual shrinkage indicates a loss of bearish momentum and the possibility of buyers retaking trendline control.
Amid the current consolidation in the crypto market, the LUNC price has obtained strong support from the $0.00008 mark. With an intraday gain of 1.08%, the coin price bounced back from the aforementioned support and prepared for another strike to the overhead trendline.
A potential breakout from the falling trendline will signal an early sign of trend reversal and provide an opportunity to enter a long trade. The post-breakout rally could surge the price to $0.000102, followed by $0.00015.
Will LUNC Price Break $0.00007?
In case the sellers continue to defend the downsloping trendline, the Tera classic coin could witness a breakdown below the $0.00008 support. This breakdown will reflect the continuation of prevailing and plunge the prices to $0.00007 or $0.00006. Thus, a breakout above the resistance trendline is needed to obtain a suitable signal for a bull trend possibility.
- Exponential Moving Average: The daily EMAs(20, 50, 100, and 200) above the LUNC price indicate the path to least resistance is down.
- Relative Strength Index: Concerning the May low at $0.00008, the daily RSI slope shows an evident rise indicating the underlying bullish momentum rising.


