


The Polyong coin price has majorly traded sideways throughout September, indicating an indecisiveness between buyers and sellers. Nevertheless, this lateral trajectory appears to be on a collision course with a key resistance trendline reclaimed intact since February 2023. The arrival at this critical juncture could catalyze an uptick in selling pressure, prompting traders to question: will Matic lose the $0.5 level amid the anticipated correction?
Also Read: Forget BlackRock, Here’s Why Gaming Industry Could Drive the Next Bitcoin Bull Run
Overhead Supply Hints Prolong Correction
- A potential reversal from the downsloping trendline may dump the price below $0.5
- A bullish breakout from the above trendline may signal a trend reversal
- The intraday trading volume of the MATIC coin is $195 Million, showing a 4.77% gain.
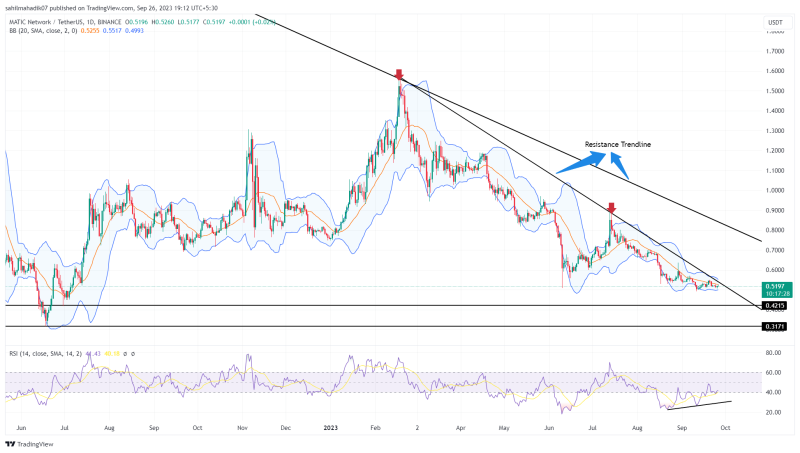
Source- Tradingview
Since mid-July, the MATIC price has witnessed a steep correction, plummeting from a $0.89 high to its current price of $0.51—a 41.8% loss that effectively wiped out the gains made during the June-July rally. While the current market sentiment remains uncertain, the coin price is moving sideways and is about to hit a downsloping resistance trend line.
With this altcoin approaching a long-standing downtrend resistance line, it’s reasonable to anticipate increased selling pressure.
This third reversal from this trendline could trigger an 18% price decline, potentially dragging the coin price down to the next key support level at $0.42.

1 MATIC to USD = $0.5089289 -2.03% (24h) Buy / Sell


Buy Crypto on an easy to use platform
Invest in leading cryptocurrencies such as Bitcoin, Ethereum, Cardano and more…

MATIC
-

btc
-

eth
-

xrp
-

bnb
-

sol
-

ltc
-

polygon
-

cardano
-

tron
-

doge

USD
-

USD
-

INR
-

JPY
-

CNY
-

GBP
-

EUR
Can MATIC Price Recover Back to $0.69?
For those bullish on Polygon’s native coin, patience could be a virtue at this point. A daily close above the aforementioned resistance trendline would signify a pivotal shift in market sentiment, providing the bulls with suitable support to initiate a recovery rally. In the event of a successful breakout, the MATIC price could target initial resistance at $0.63, followed by a more ambitious target of $0.69
- Bollinger Band: The constricted range of the Bollinger Band indicator suggests heightened volatility for the asset in question.
- Relative Strength Index: The upward trajectory of the RSI slope signals that buyers are making efforts to overcome the overhead resistance level.


